Essential PC Gaming Metrics Worth Tracking and Their Importance
Essential PC Gaming Metrics Worth Tracking and Their Importance
Highlights
- Monitoring in-game performance metrics can help you identify potential bottlenecks, make tweaking in-game visual options easier, and show you which visual options gobble up the most resources.
- Tracking GPU and CPU usage as well as CPU per-core usage reveals potential bottlenecks.
- Other handy in-game performance metrics include video memory usage, RAM usage, real-time and average frame rate, as well as frame time-related metrics.
Like many other PC gamers, I have a list of favorite in-game performance stats I monitor in every game. These help me understand which settings I need to tweak to get the best performance out of my games. Here’s how you can do the same.
Why Monitor Game Performance Stats Anyway?
First and foremost, most of the time, I just want to check the overall performance in frames per second (FPS). Next, I like to have performance stats on-screen while tweaking visual settings to check overall performance and the impact of individual options on the frame rate.
Monitoring in-game performance metrics is great for spotting bottlenecks , whether on the GPU or CPU side . You can do this by watching the usage percentage of your graphics card and CPU.
Another use case is when I notice in-game stuttering. If gameplay doesn’t feel smooth, you can turn on the frame time graph and see if it shows large frame time differences in the form of frame time spikes.
In-game performance stats can also display your CPU and GPU thermals and the amount of GPU memory used. This is useful when you’ve got a GPU with 8GB or less vRAM and want to see whether you’ve maxed out video memory by applying visual options like high texture quality. You can also show the total amount of RAM used, the amount of RAM used by the game you’re playing, the amount of power used by the CPU and GPU (handy when overclocking or undervolting your CPU or GPU ), real-time clocks of your GPU and CPU, and a bunch of other stats.
That said, I don’t monitor each and every stat available. I’ve got a default in-game performance stats suite that I use in most games, which I occasionally tweak for specific bottleneck-hunting scenarios.
GPU Usage Percentage, Temperature, and Power
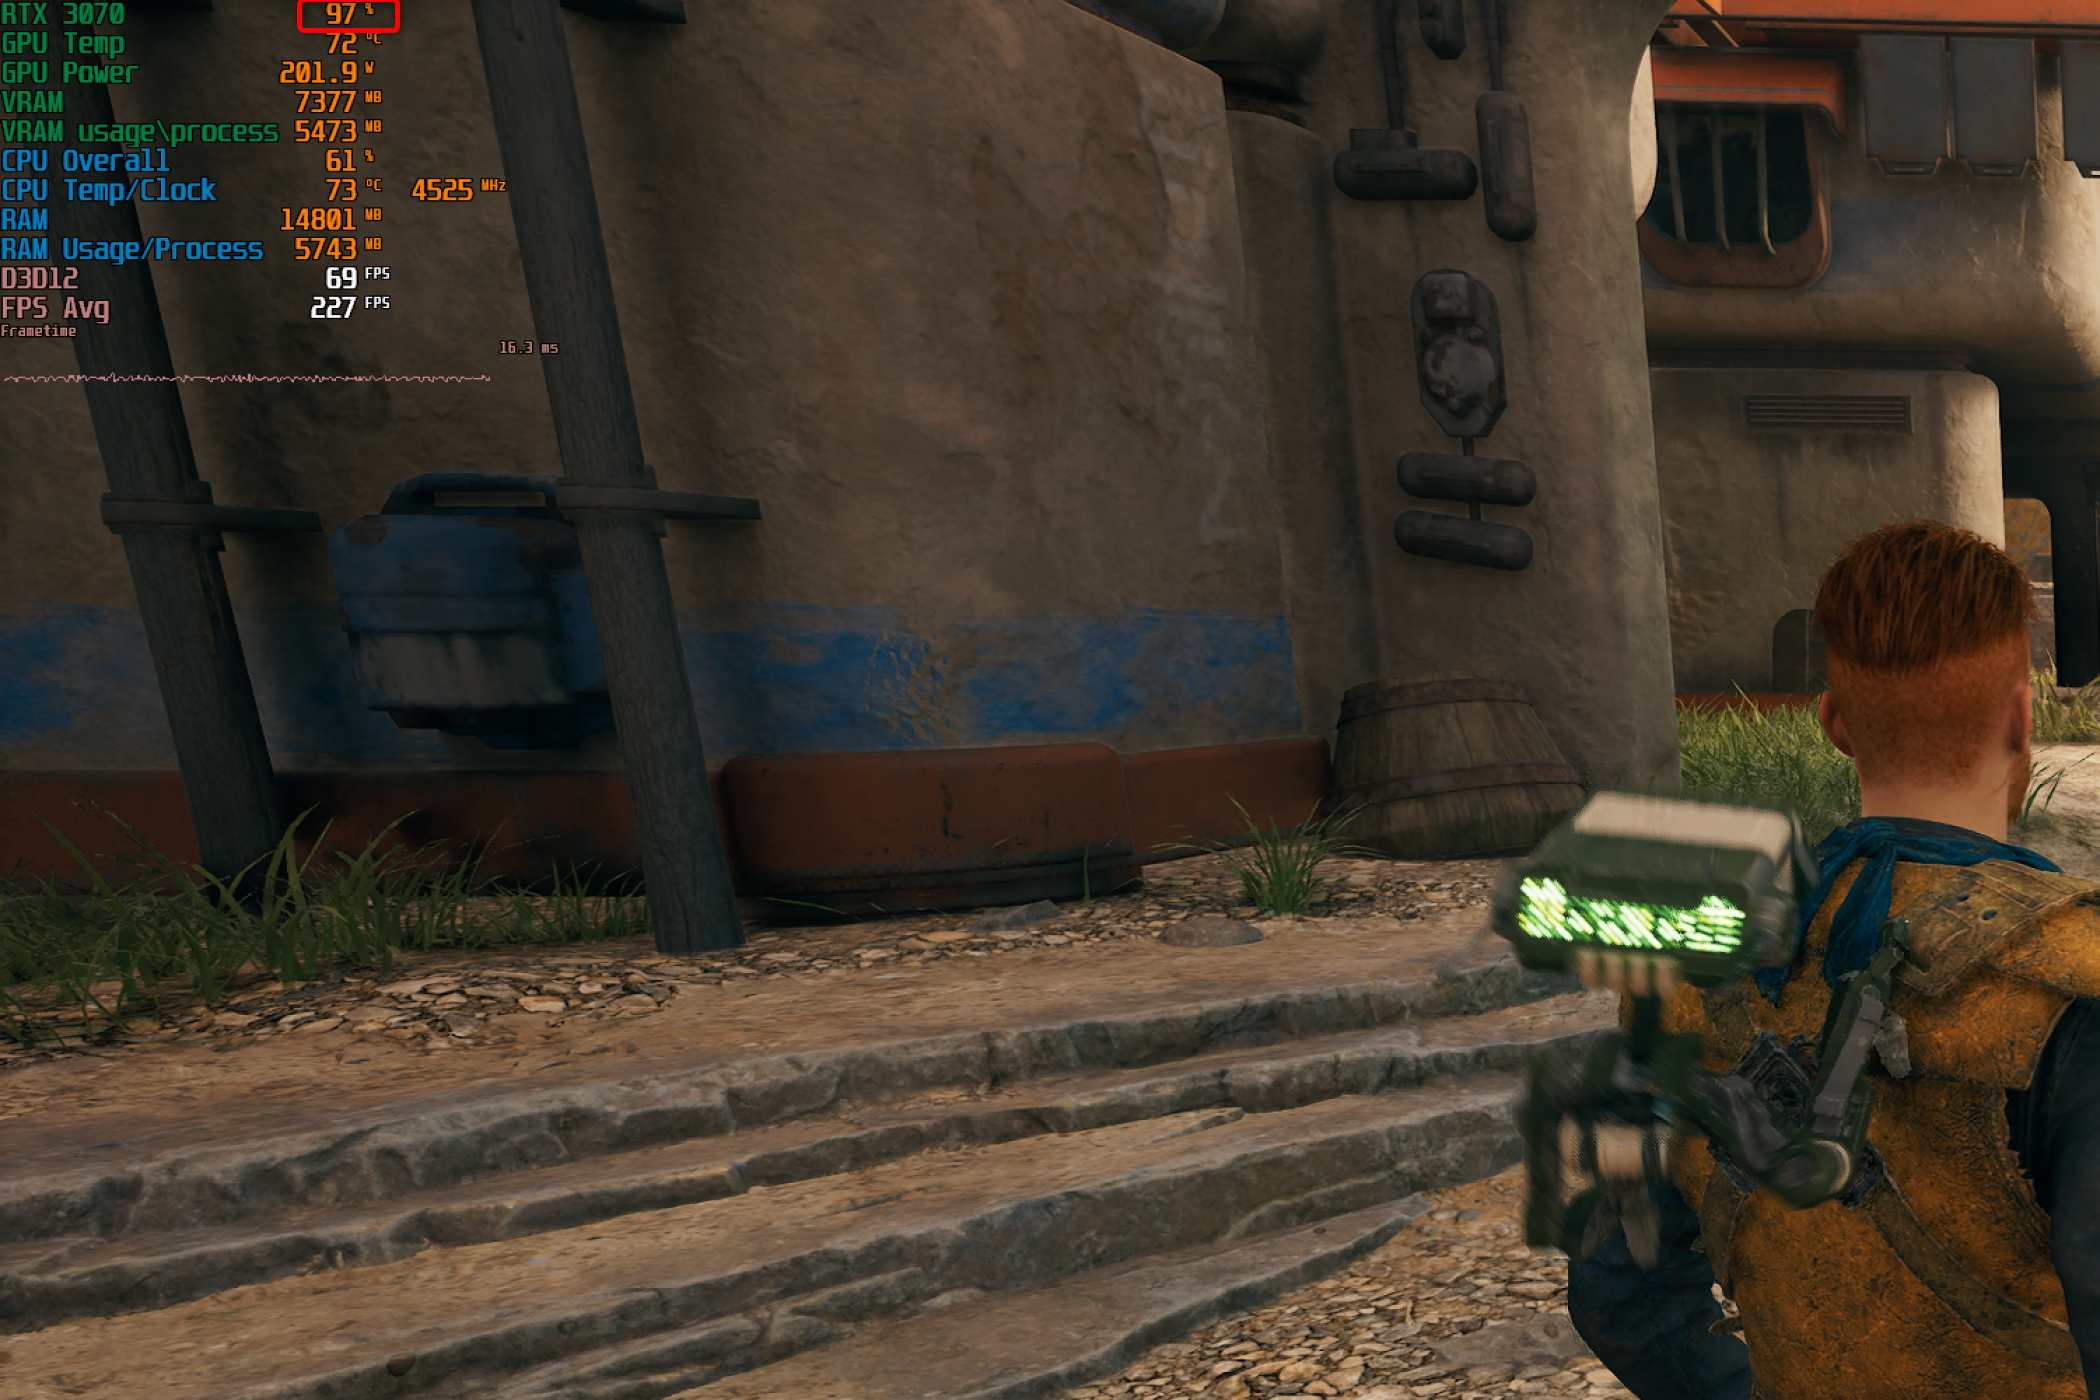
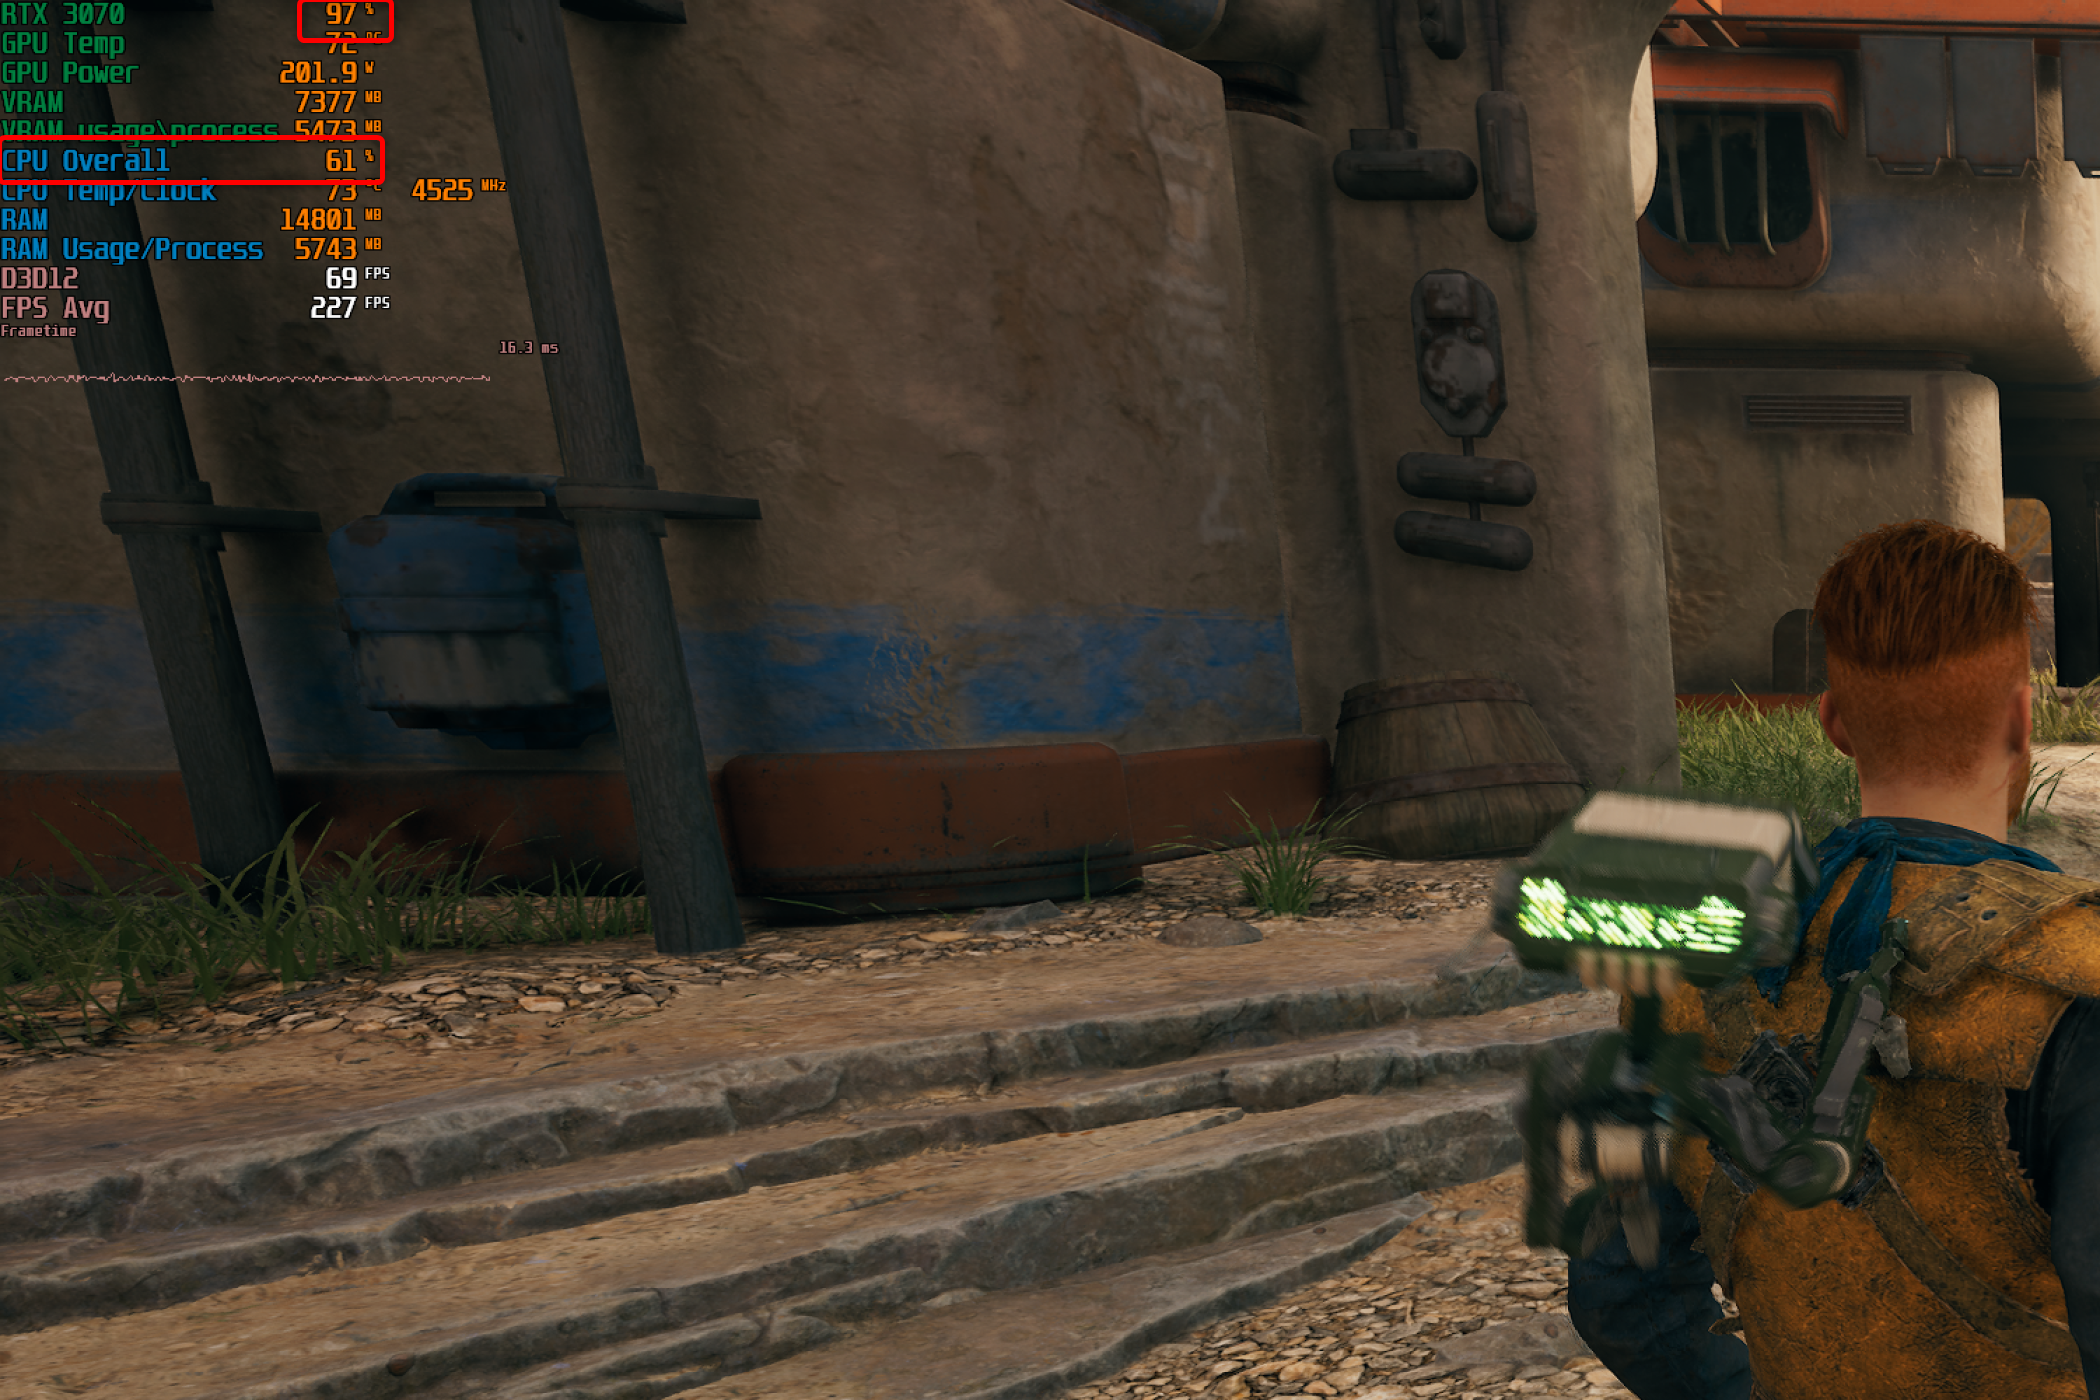
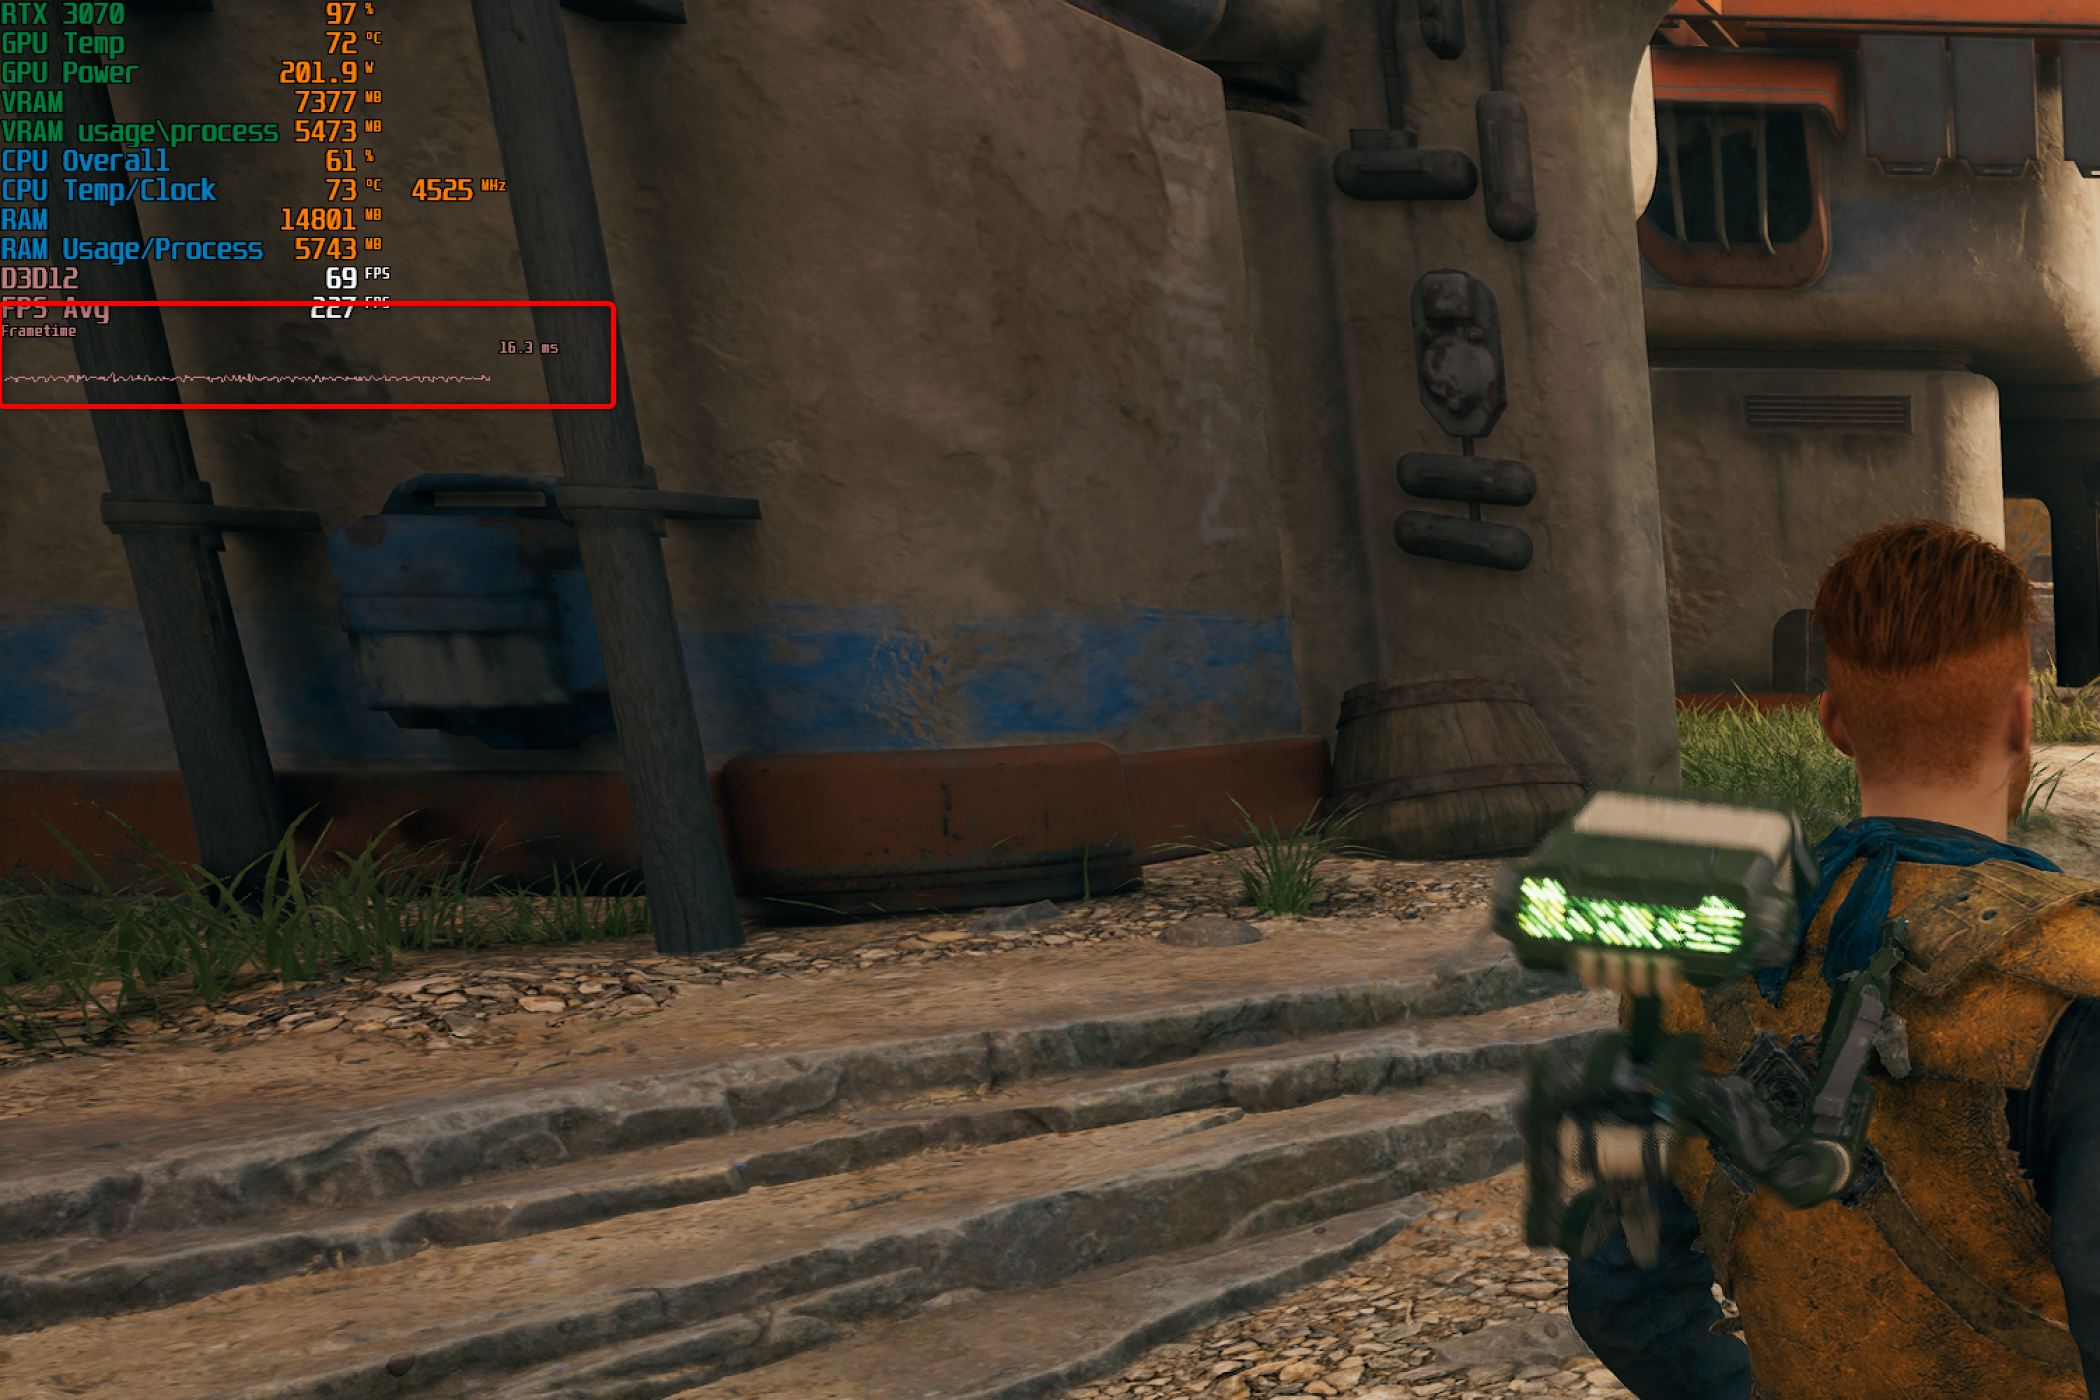
GPU usage percentage and frame rate are the most critical in-game performance stats. If your GPU usage is in the high nineties—95% and higher—you’re fine, and your graphics card is working at its optimal maximum. As you can see in the screenshot below, my GPU usage is 97%, which is optimal.
If the GPU usage drops below 90%, something’s wrong. The most likely situation is that your CPU is running at its maximum but cannot keep up with the GPU. In other words, if your GPU usage percentage is below 90%, your CPU is most likely a less-than-ideal pairing for your GPU. The CPU is the bottleneck in this particular case.
The game I’ve used to show which in-game stats I monitor is Star Wars Jedi: Survivor. I specifically chose this game because it has highly unstable performance and a bunch of stuttering of various origins. The game also hits the CPU pretty hard, especially in larger, semi-open-world levels such as Koboh.
That said, low GPU usage can have a plethora of other causes. One potential cause is that your VRAM buffer is maxed out, so your operating system starts using system RAM, which causes massive performance drops because system RAM is much slower than GPU memory.
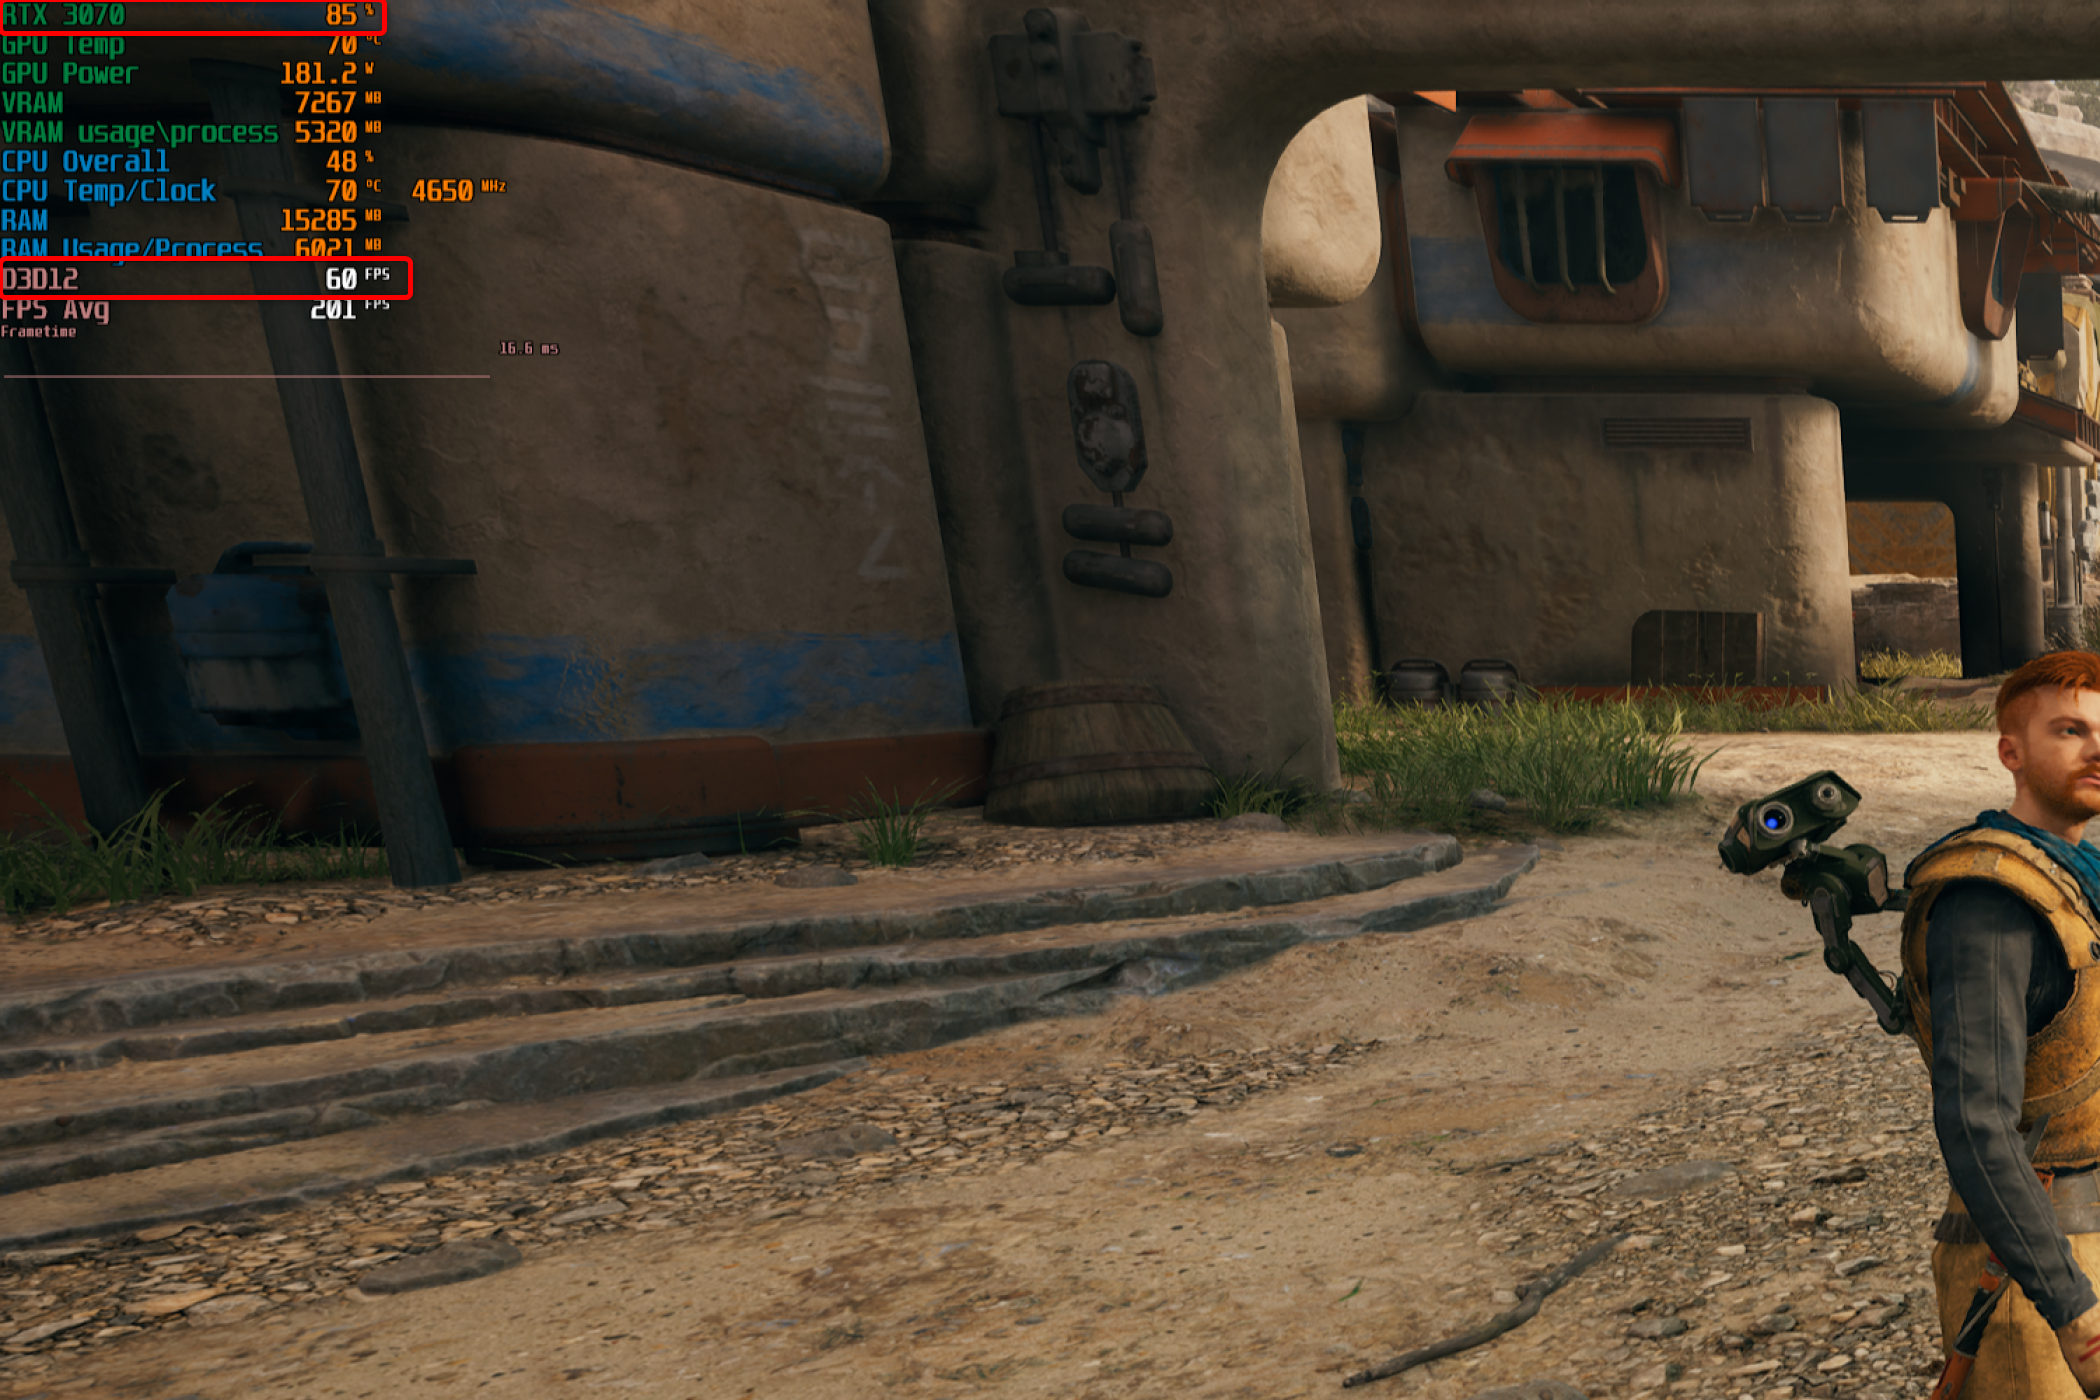
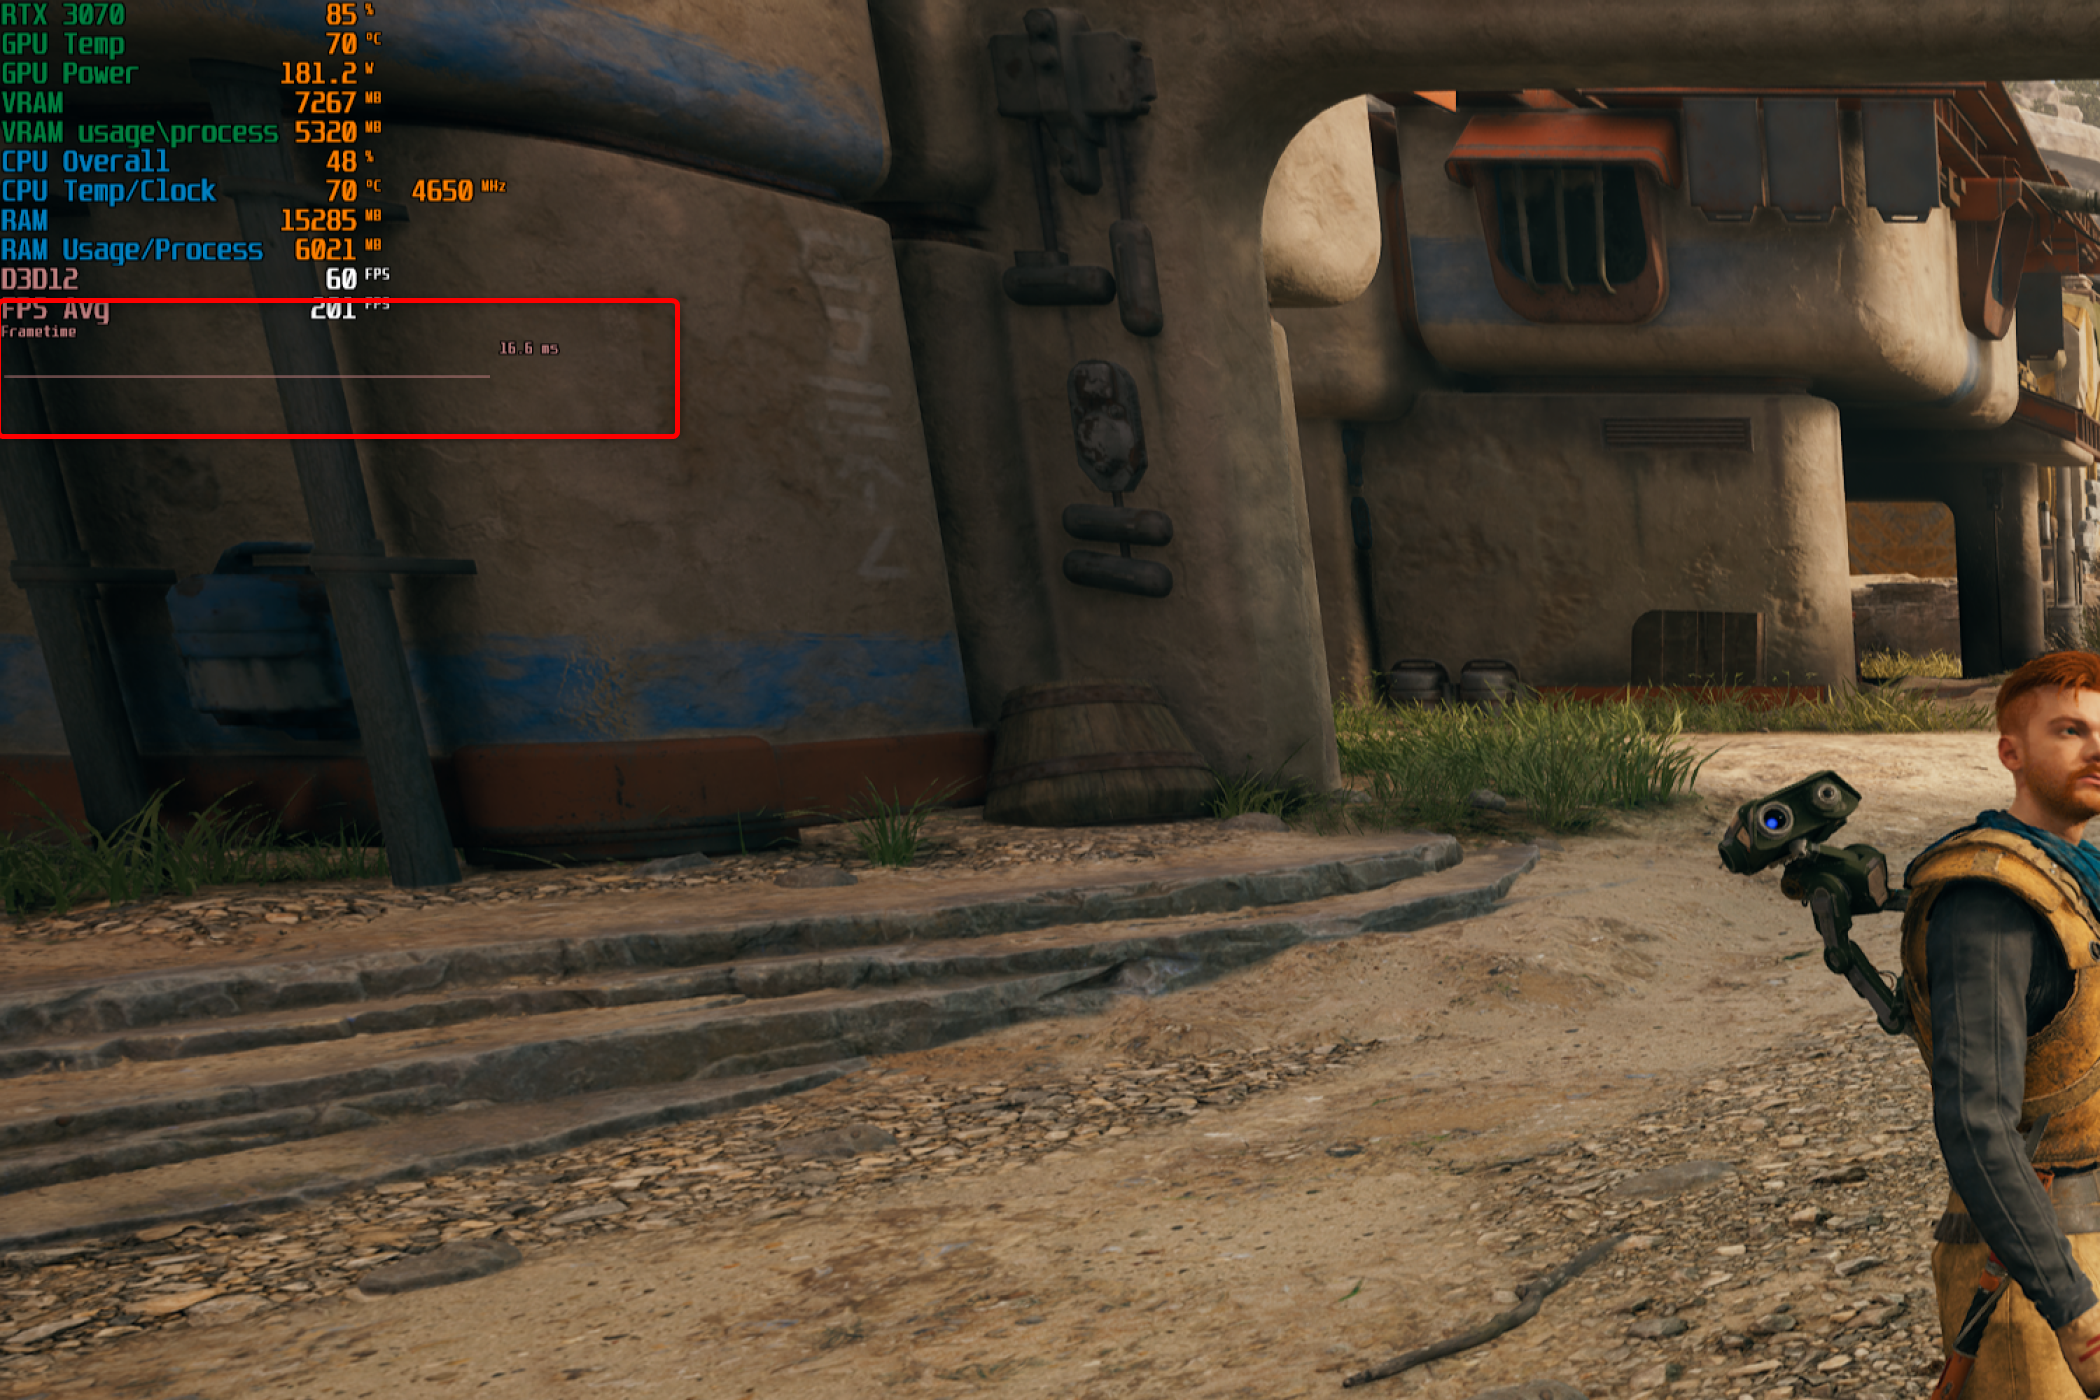
Next, you might have accidentally limited the frame rate and forgot about it. For example, I limit the frame rate to 60fps in a number of games I play. My monitor has a VA panel , which makes it prone to flickering with VRR on, so I have to turn off VRR in some games and limit the frame rate to disable image tearing. As you can see below, when I limit Jedi Survivor to 60fps, my GPU usage drops to about 85% because the GPU can run the game at a higher frame rate than 60fps.
Another potential cause of low GPU usage is if the game suffers from shader compilation or traversal stutters. In the example below, the cause is traversal stuttering, triggered by moving to another portion of the map that has to have its assets loaded in the background. This leads to noticeable stuttering for a few seconds, during which the GPU usage percentage drops. It gets back to the high nineties shortly after.

Other causes of low GPU usage include not having enough system RAM, limiting the GPU power (accidentally or purposefully), your GPU cooler having issues leading to GPU thermal throttling , and others.
Aside from the GPU usage percentage, I also monitor the GPU temperature and power used. The former is handy in my case because I’ve got a hotbox of an enclosure, also known as the NZXT H510. The case looks great, which is the main reason I purchased it. Conversely, the H510 has pretty poor airflow that results in much higher GPU and CPU thermals compared to the best PC cases . This is why I like to have my GPU temperature always shown on the in-game performance overlay.
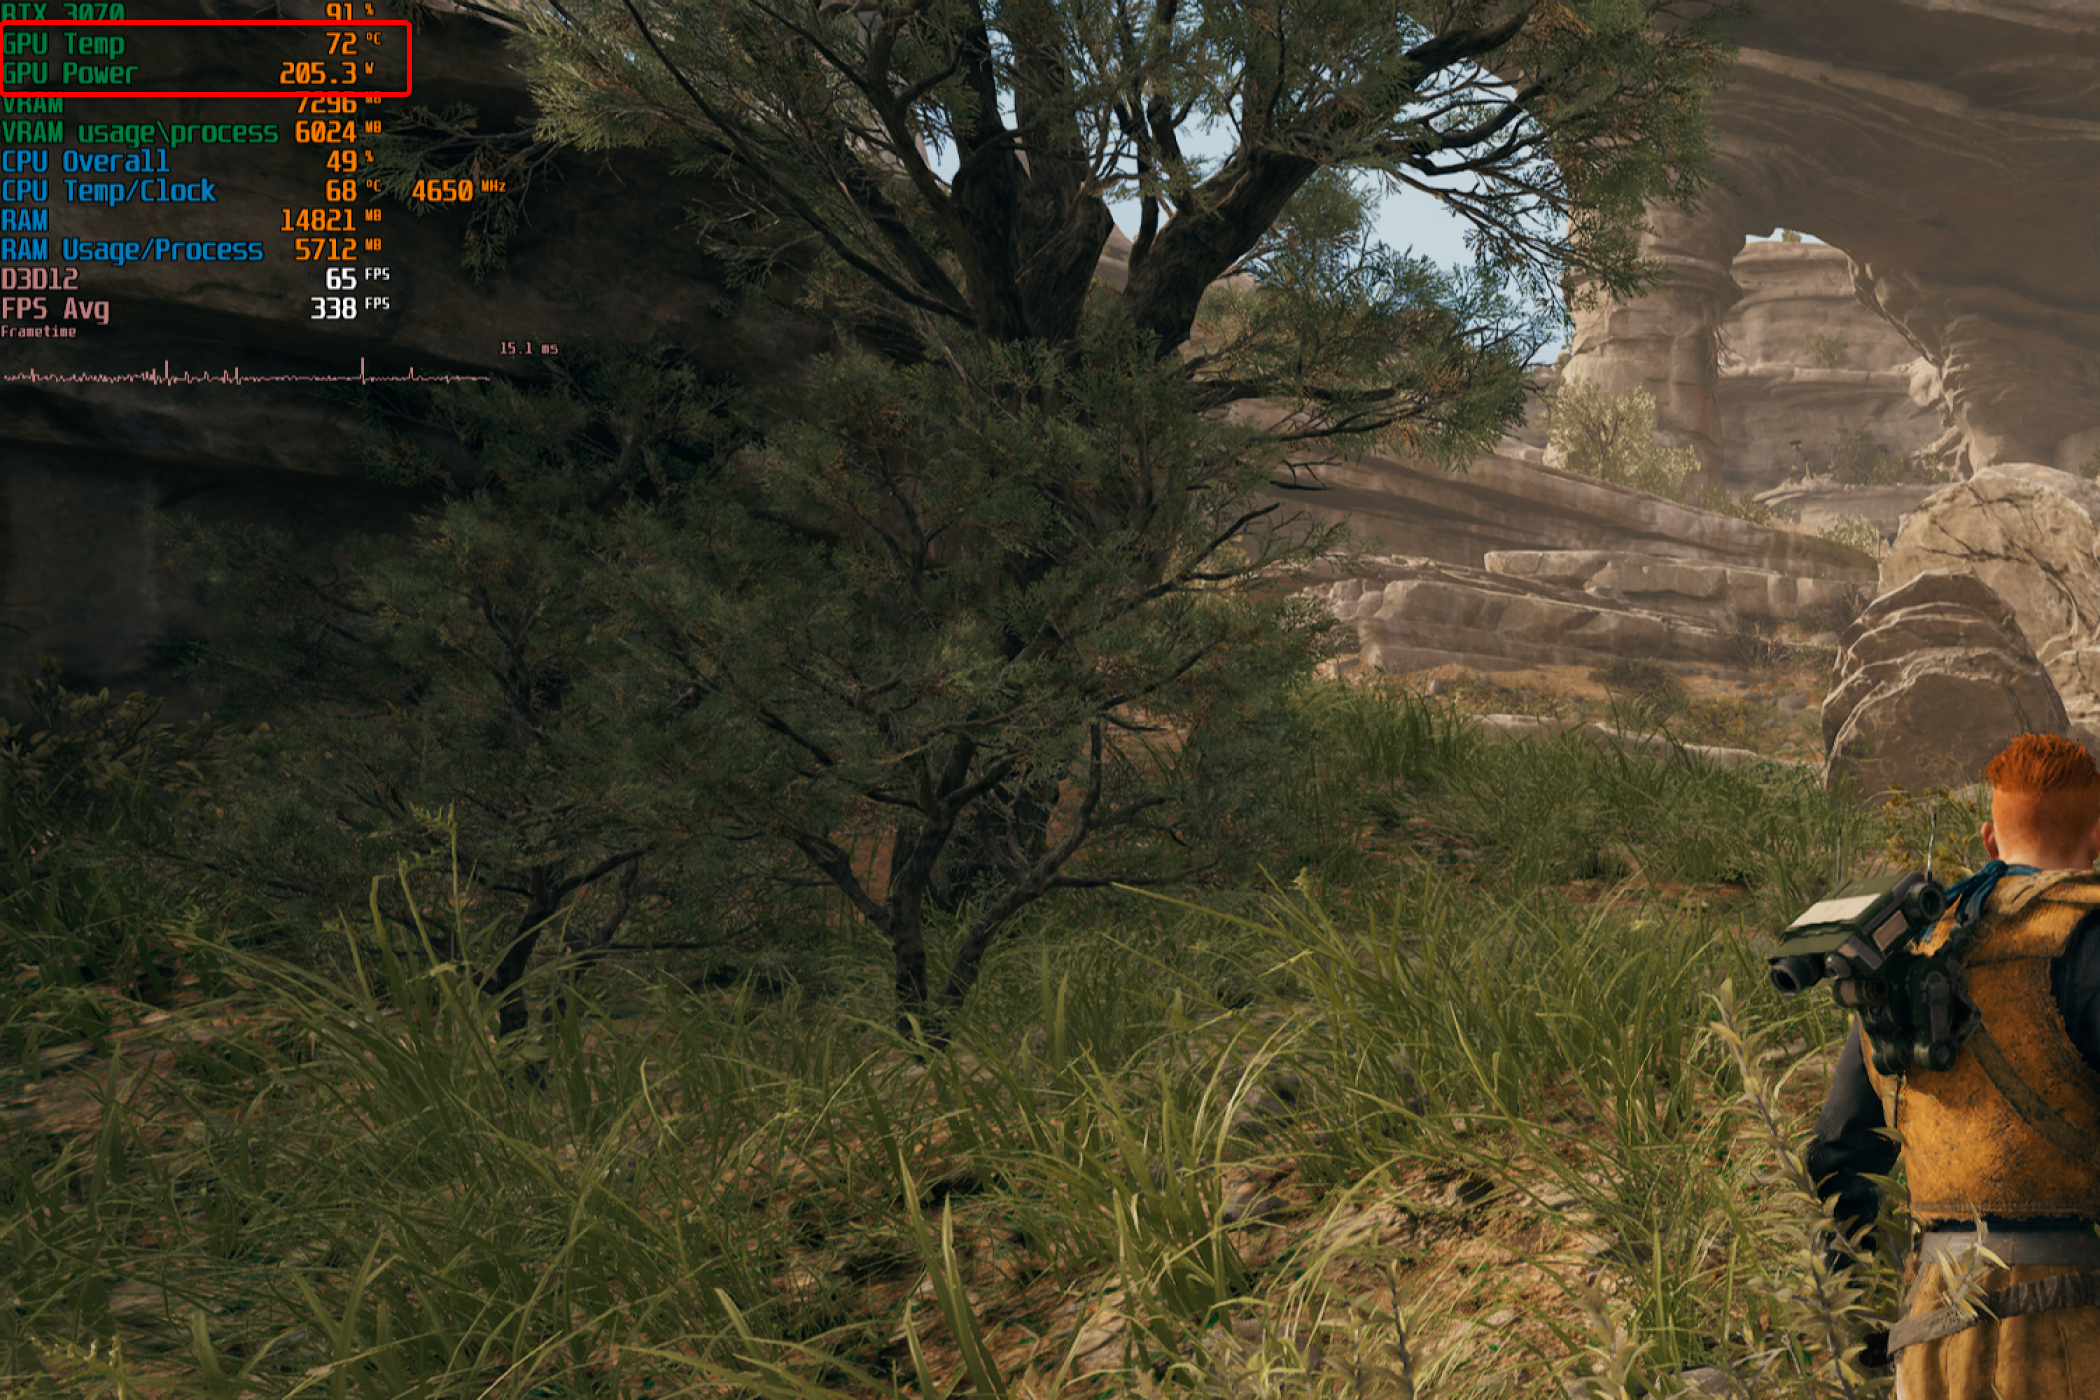
GPU power, measured in watts, and thermals, are handy to check after you’ve undervolted your GPU to see if undervolting it reduced the heat buildup and power used. They’re also nice to have in case the game slows down unexpectedly, like when your GPU memory buffer overflows. If you see that your GPU usage dropped along with GPU power, and you notice that your GPU memory usage is running close to your GPU memory size, you can infer that you probably need to lower texture quality or turn off ray tracing effects since these use a ton of video memory.
GPU Memory Used
GPU memory is yet another in-game stat I always have on. It’s mostly because I own an 8GB GPU—an RTX 3070—and those 8 gigs of memory often fill up with max texture quality in many recent AAA games. This is especially true when running those games at the native, 3440x1440 resolution of my monitor, instead of streaming them to my ROG Ally’s 1080p screen.
As shown in the screenshot below, you’ve got the total memory used and the memory used by the current process, in this case, Jedi Survivor. If this goes near or surpasses 8000MB for the total memory used, it means I should drop some visual option that uses a lot of GPU memory. In most cases, this is texture quality, but sometimes I can keep high textures but drop shadows to medium or turn off RT effects if I have them on.

You don’t have to have both the “VRAM” and “VRAM Usage/Process” stats shown, but I like to have both because a too-high discrepancy between the two values might reveal that I have my browser or some other app that uses lots of video memory open and running in the background.
For example, on Windows, it’s normal for the system to use anything between 1GB and 1.7GB of video memory. The higher the resolution of your monitor, the more vRAM the system reserves, and this also applies to multi-monitor setups. So if I notice that the system is using more than 2GB of video memory, I check whether my browser or any other app is running in the background.
CPU Usage Percentage and Per-Core CPU Usage
In most games, I only monitor the total CPU usage percentage. But if I notice low GPU usage coupled with high CPU usage—50% or higher—I usually enable the per-core CPU usage metric.
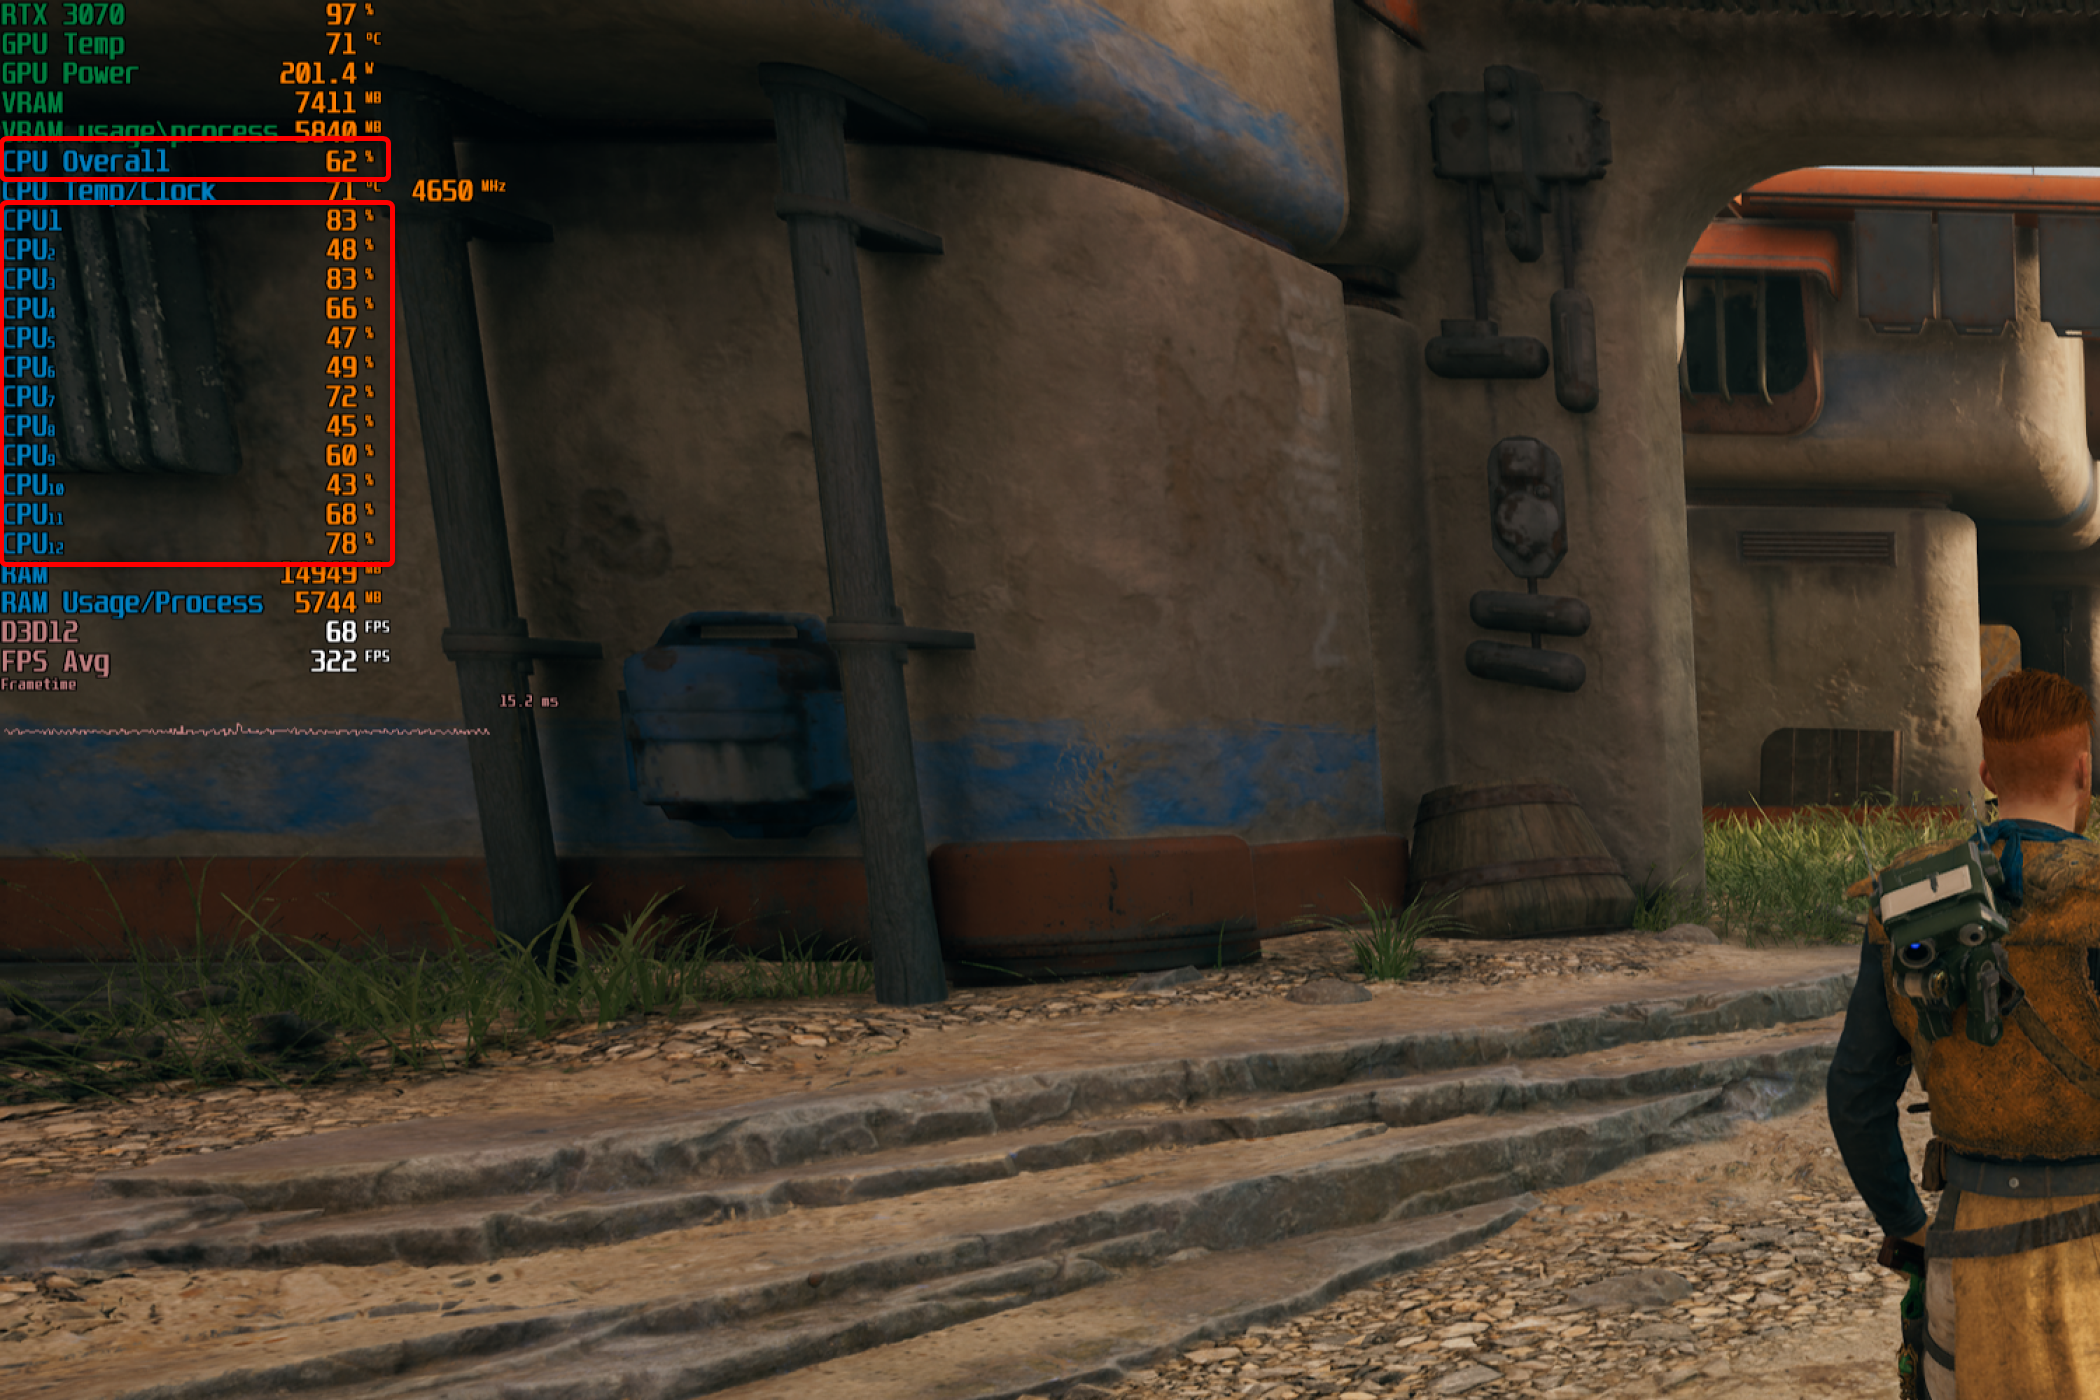
As you can see below, Jedi Survivor can punish your CPU. That said, my RTX 3070 is not powerful enough for my Ryzen 5600X to become the bottleneck, at least in Jedi Survivor, since the GPU usage sits at 97%.
In Marvel’s Spider-Man Remastered, on the other hand, my Ryzen 5600X was maxed out with RT reflections enabled, and RT quality set to 8 or higher. This led to performance drops when swinging around the city. So, when I had turned on per-core CPU monitoring, I noticed that when web swinging around Manhattan my CPU usage went north of 90% and my GPU usage dropped below 80%. This is a clear sign that my CPU is the main bottleneck.
Per-core CPU usage can also help you spot CPU-limited games that don’t use all your CPU cores. For example, Gotham Knights is a poorly optimized game that uses just a few CPU cores. This means your CPU is the main bottleneck, even if the overall CPU usage is relatively low.
But if you turn on per-core CPU usage in that game, you will notice that only a few CPU cores are maxed out, with the rest being utilized rather lightly. This, combined with low GPU usage, means that your CPU is the bottleneck in this particular case, even though the overall CPU usage is low. The video analysis below, courtesy of Digital Foundry, does a great job of showing the Gotham Knights’ CPU issues. Note that the game has received multiple patches since the time when the video was made, but that it still suffers from relatively poor CPU utilization.
RAM Usage
As for the RAM-related metrics, I monitor total usage and the amount of RAM used by the game I’m playing—labeled as “RAM Usage/Process” in the screenshot below.
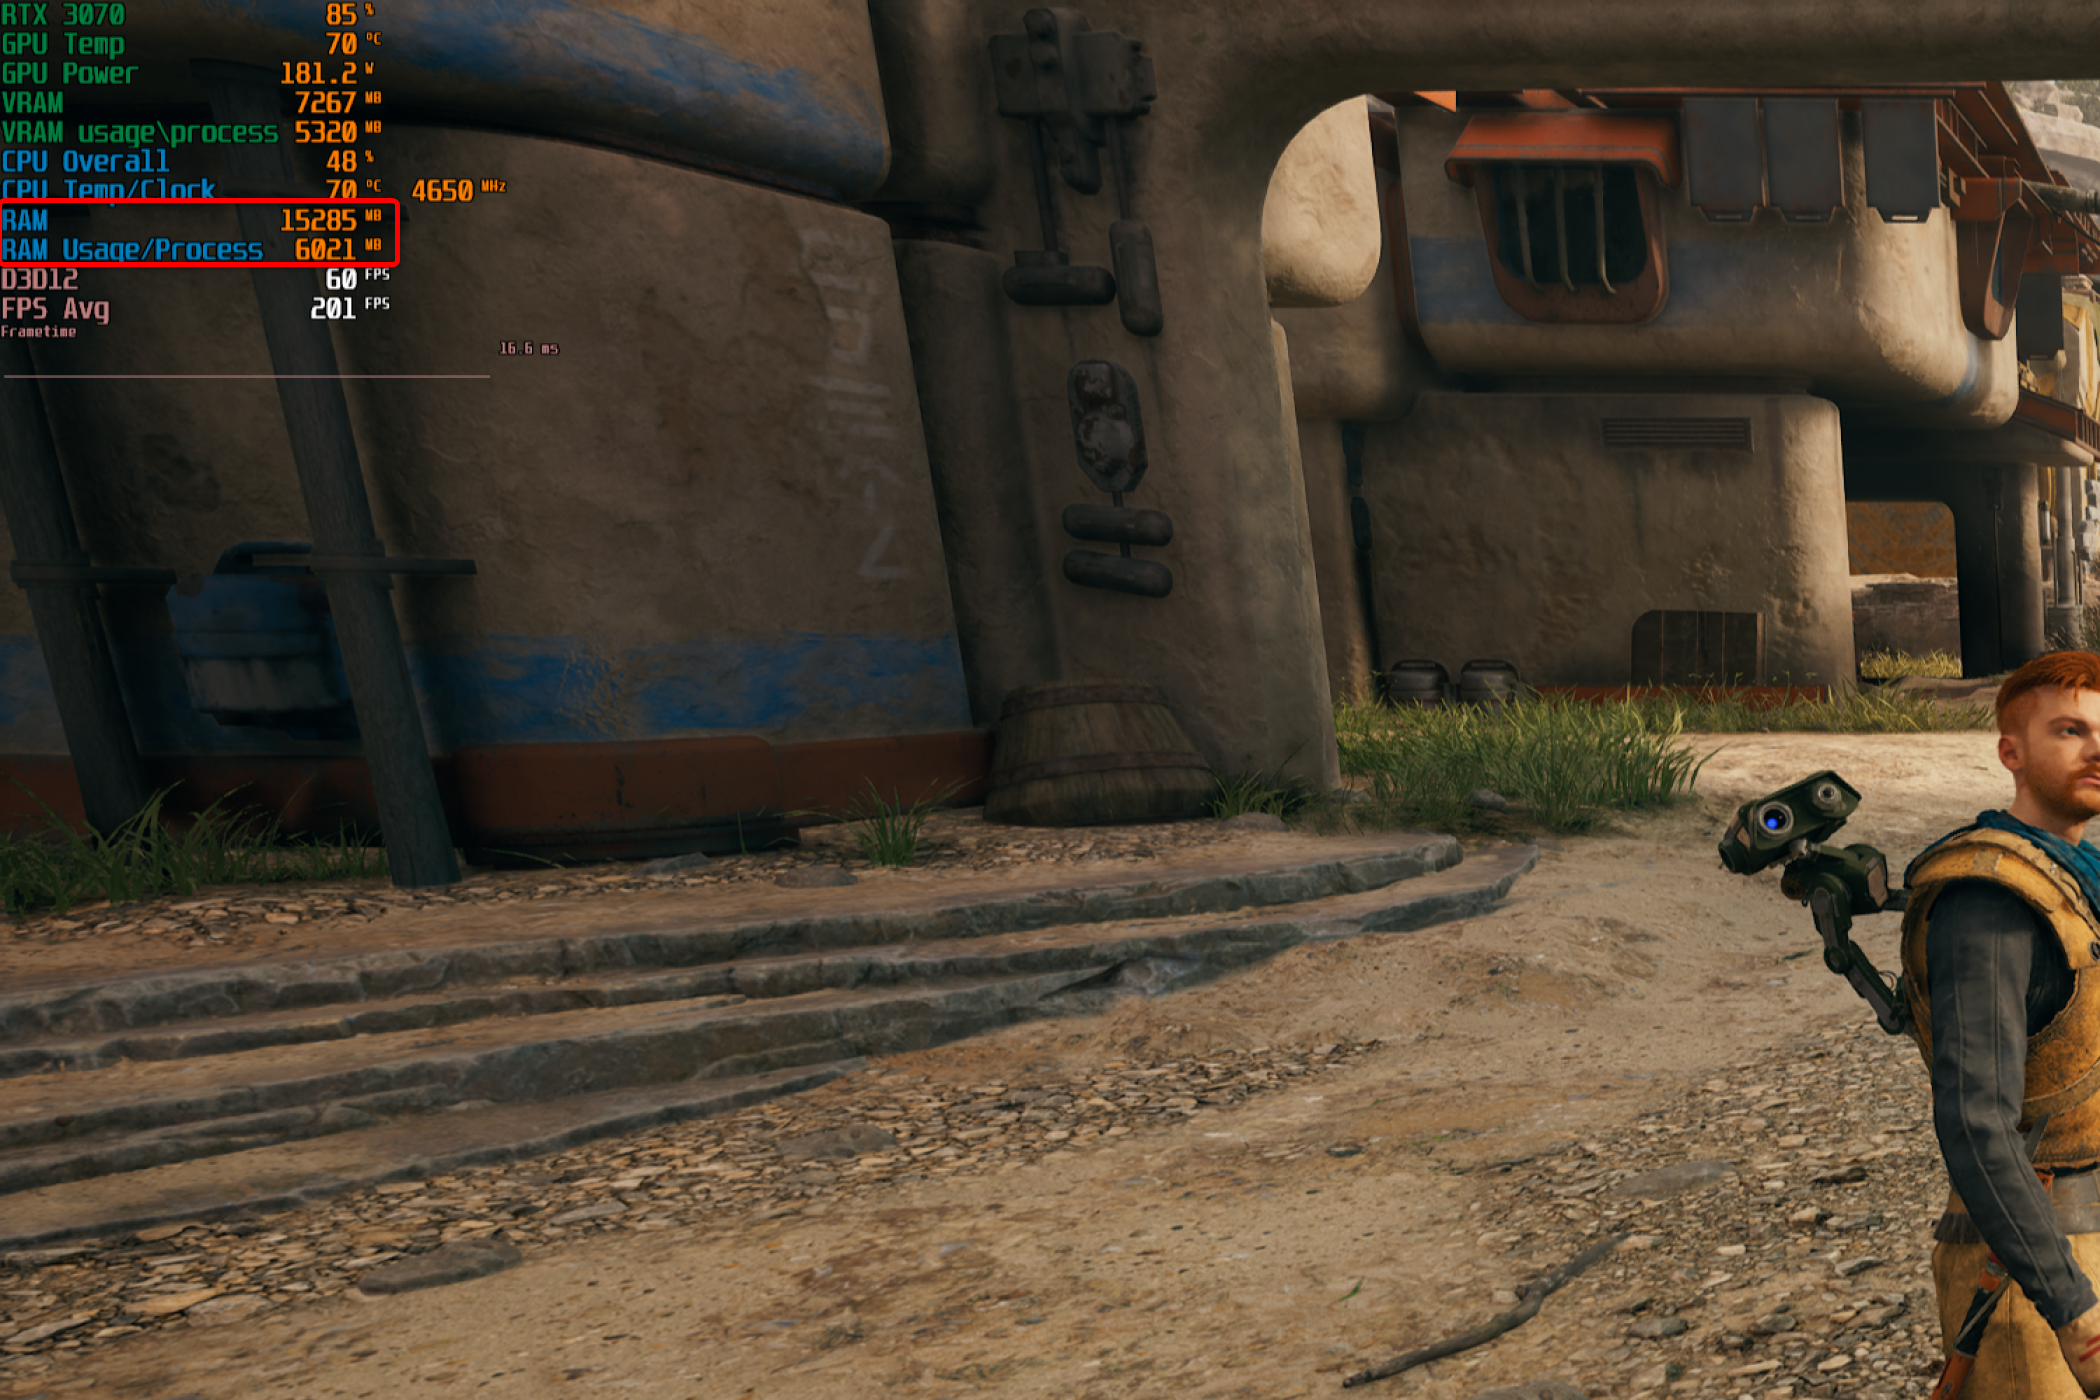
Since I have 32GB of RAM, this isn’t an important stat for me personally. However, if you’ve got a gaming PC with 16GB of memory or less, this stat can show when the game you’re playing is using too much of your system RAM.
Real-Time and Average Frame Rate
Regarding frame rates, I only monitor current and average frame rates. The real-time frame rate stat is handy for checking out in-game performance in different game areas or levels, especially when tweaking visual settings.

The average frame rate is not that helpful, especially in the example above where the game runs at unlimited frame rates in the menus, resulting in a crazy high average fps value, but I like having it just because.
Frame Time Graph
Lastly, we’ve got the frame time graph. This is a super important in-game stat to monitor, especially since more and more PC games seem to display frame pacing issues.
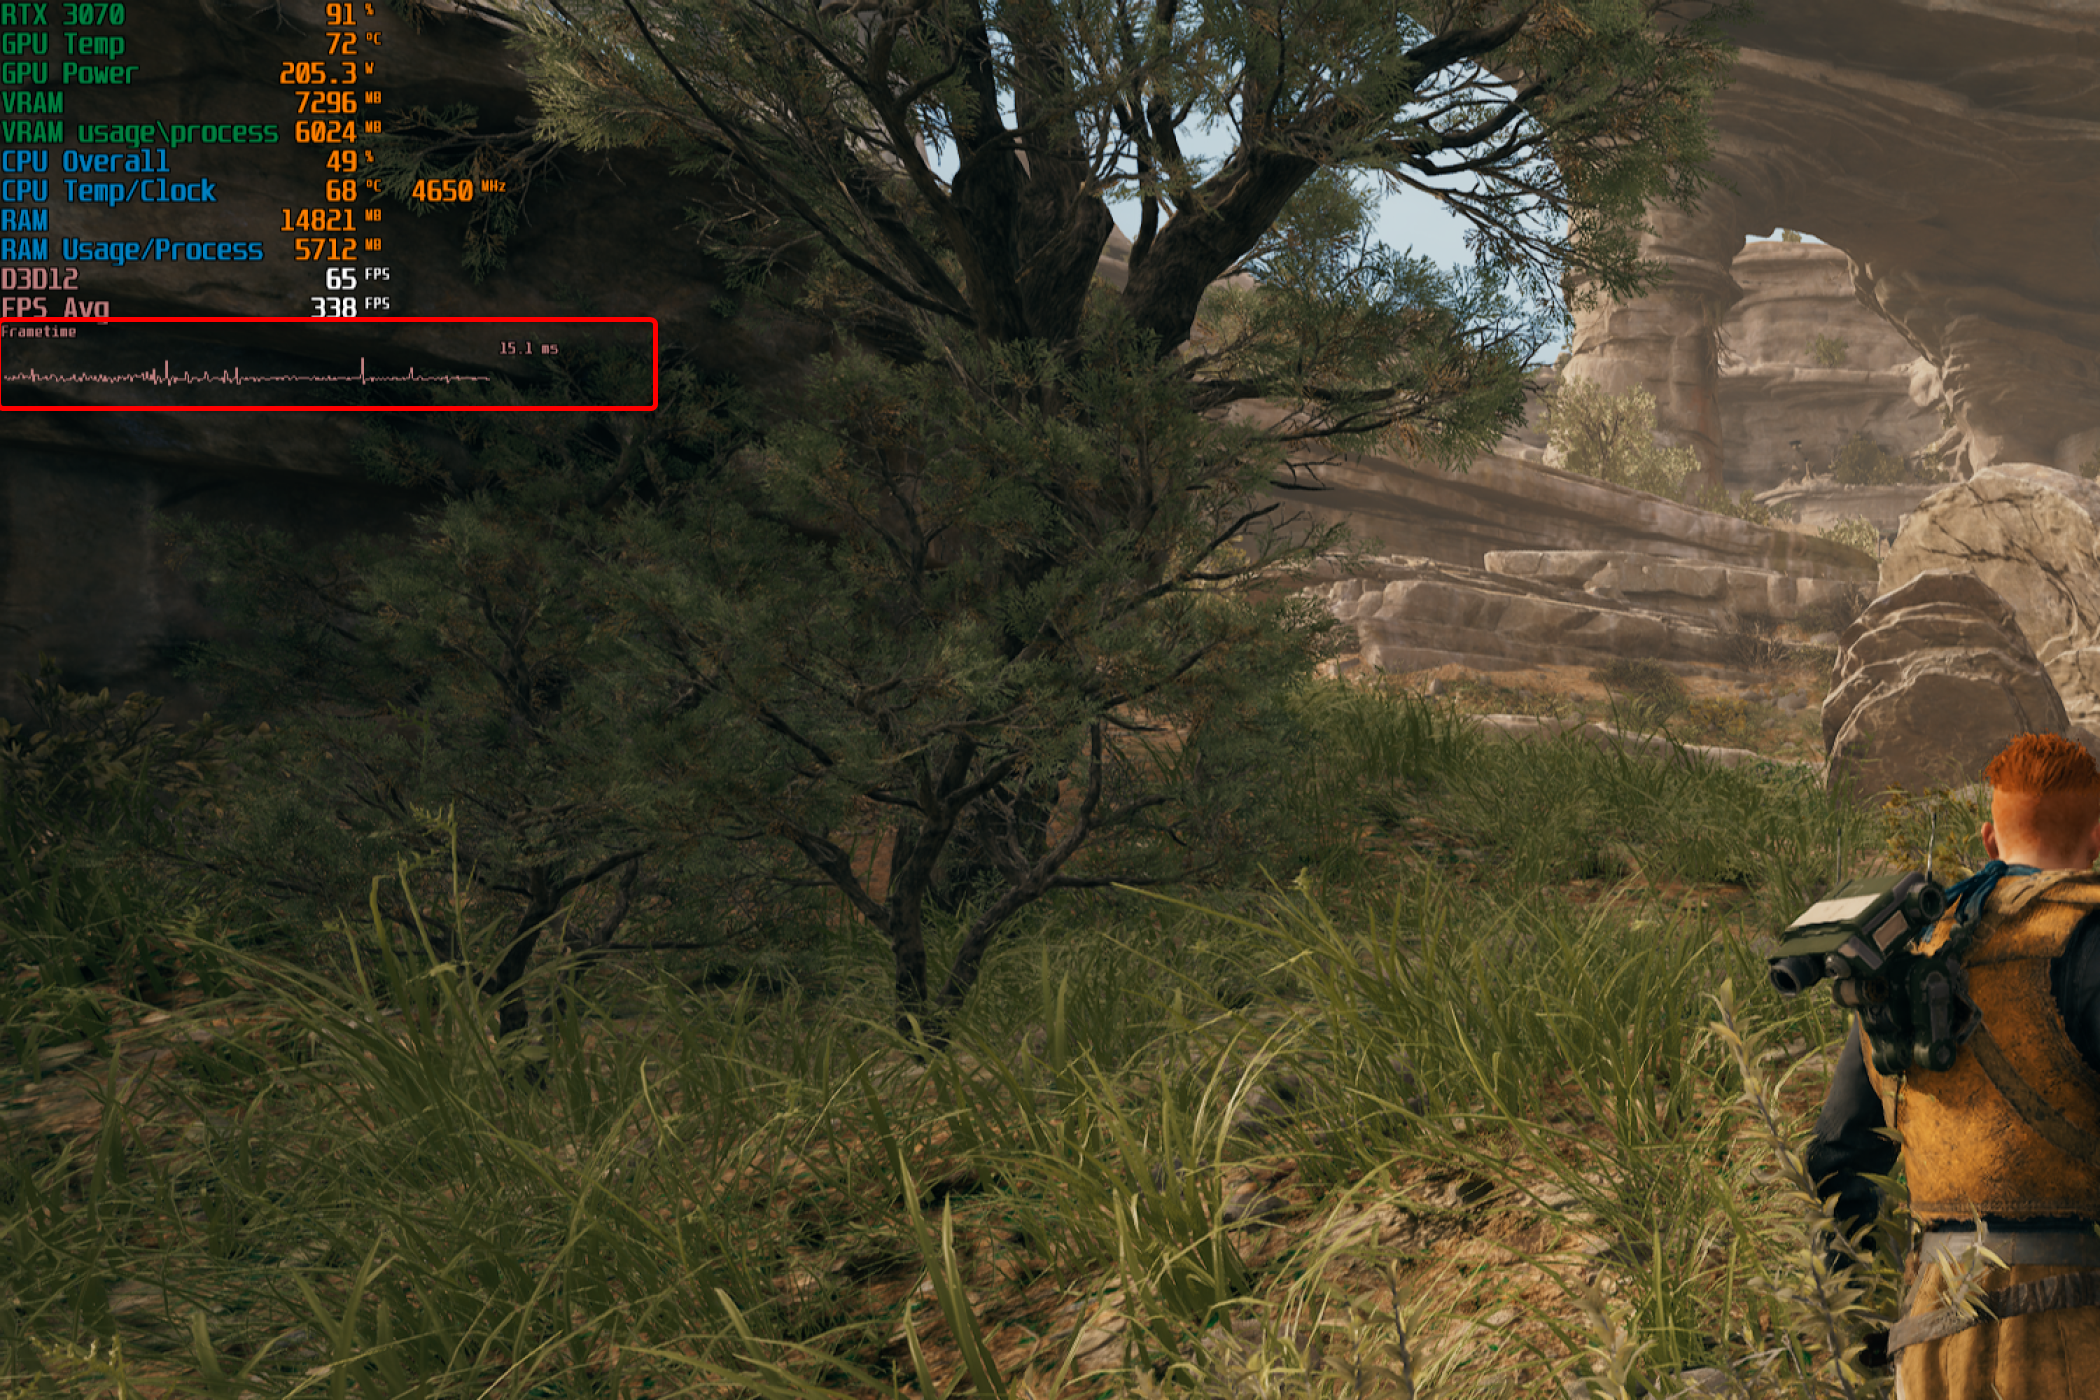
If you unlock the frame rate, you want to see a frame time graph similar to the one below. The line has some inconsistencies, but those are caused by the variable frame rate.
If you lock your fps to 60, as I did below, your frame time graph should be completely flat. This is a perfect-case scenario that happens only if you lock the frame rate or have a PC powerful enough to always run the game at the maximum refresh rate of your monitor.
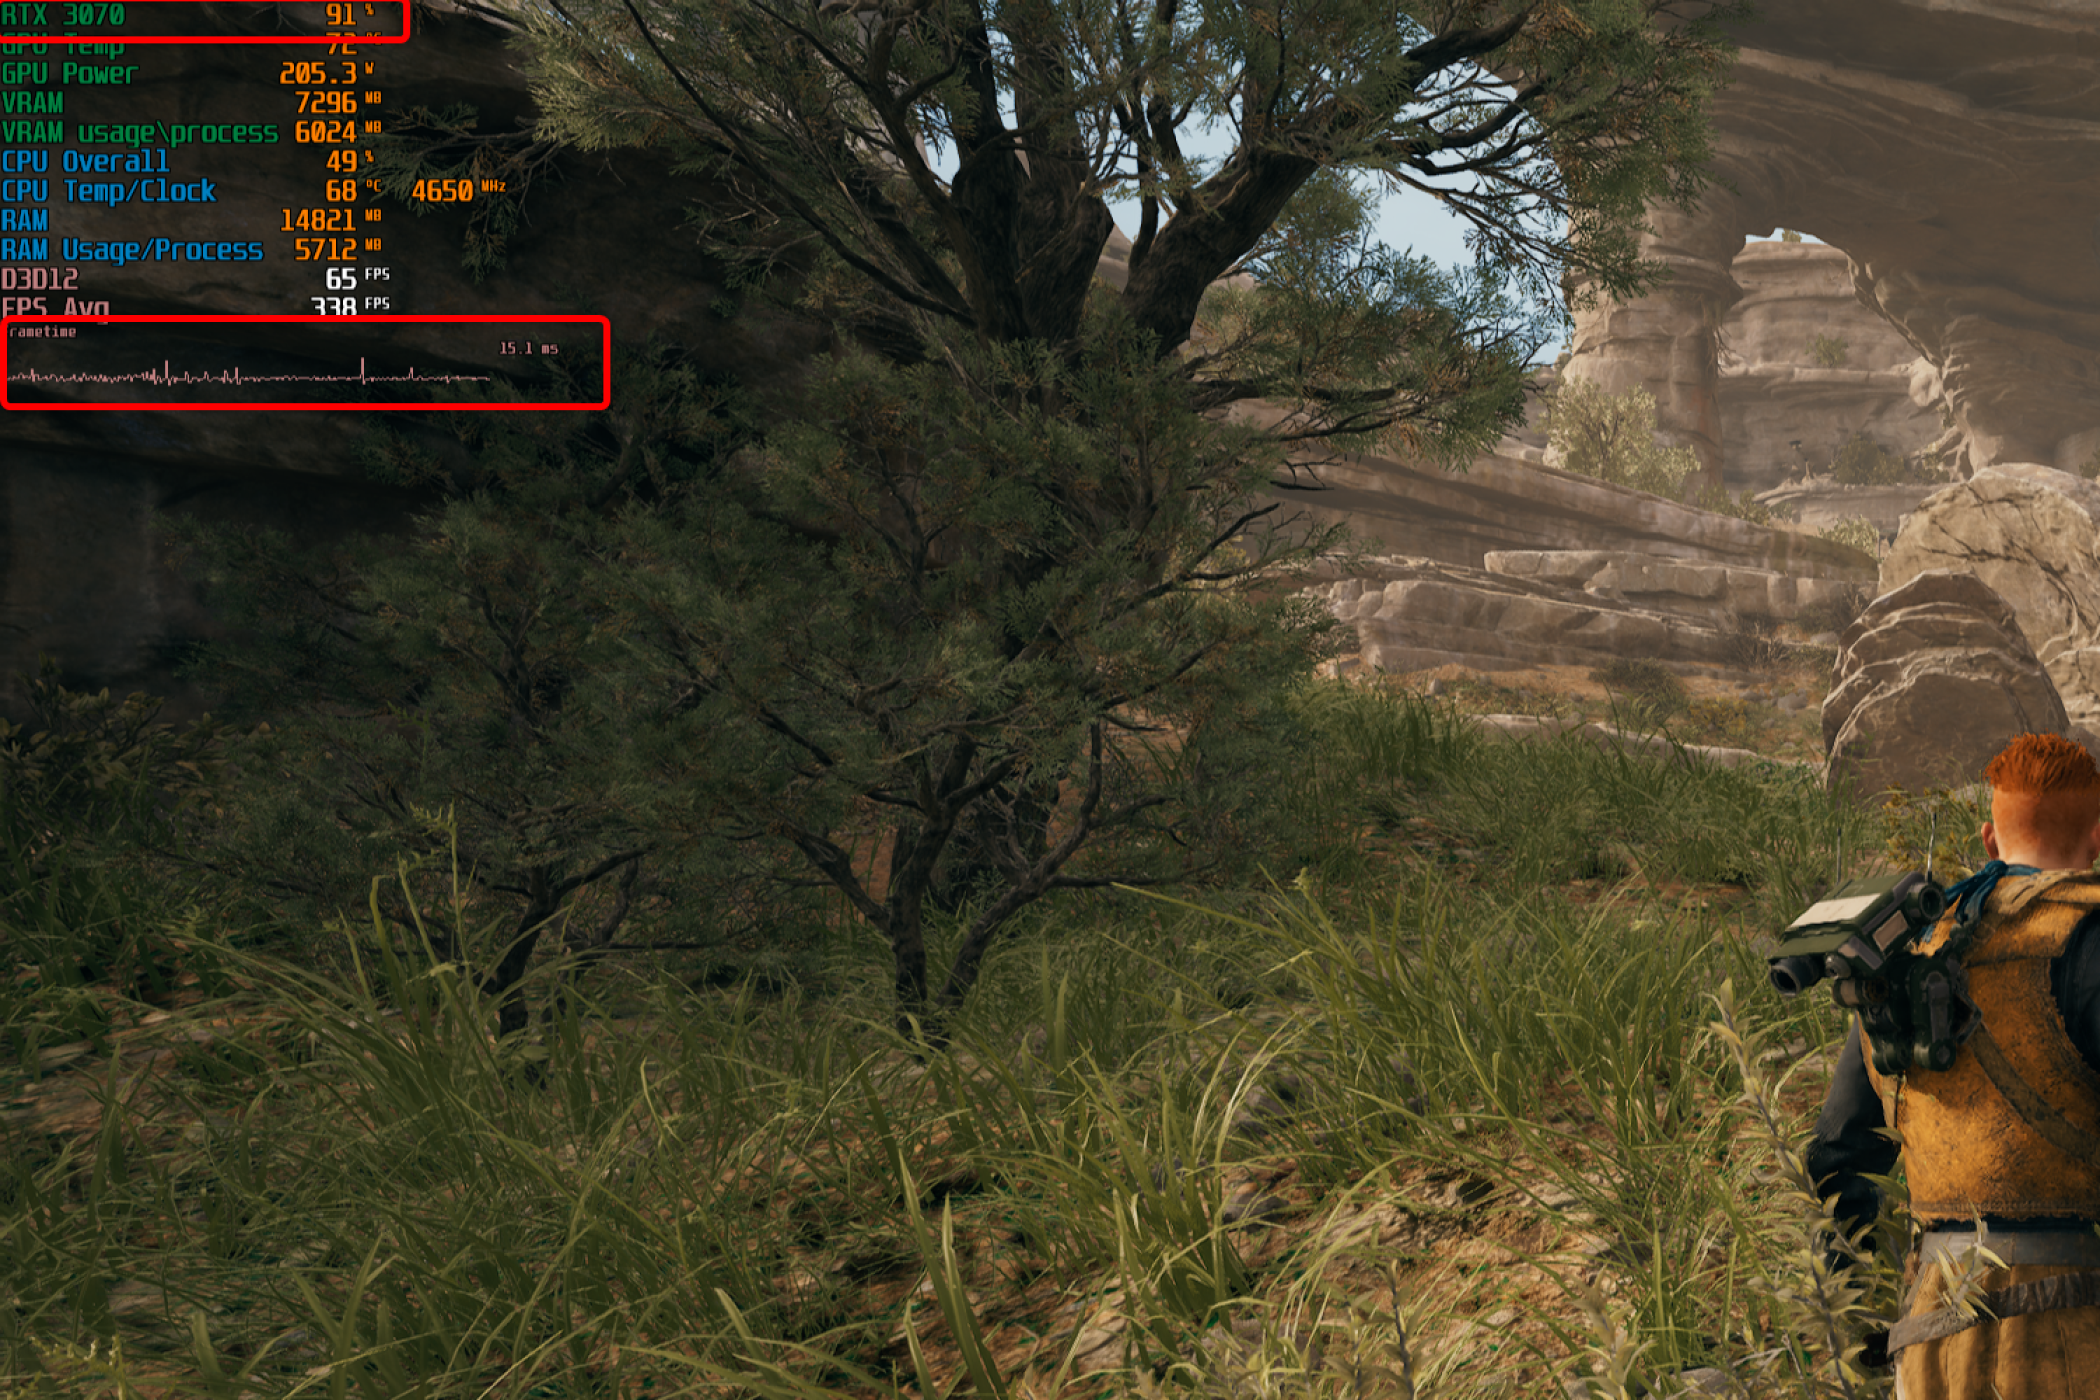
What you don’t want to see is the example below. Those massive spikes on the frame time graph represent traversal stuttering that plagues Jedi Survivor. The graph below shows the moment when Cal goes from the main settlement in Koboh to the wilderness, with the game loading the next portion of the level in the background, resulting in quite noticeable traversal stuttering.
The frame time graph is helpful in situations like these; when you notice that your game is stuttery, but your performance metrics show high average frame rates and high CPU and GPU usage.
Picking the Right Stat Monitor Tool
In-game performance stats monitoring is a great way to not only optimize in-game settings depending on the performance you’re after, but also to identify CPU and GPU bottlenecks, check whether your GPU has enough memory to run the game with max textures, and investigate why your game runs poorly or unevenly, and why it feels stuttery even though the average frame rate is high.
If you’re interested in monitoring in-game performance stats yourself, check out which 3 in-game performance monitoring tools I recommend to every PC gamer.
Also read:
- [Updated] 2024 Approved Step Into VR Wonderland YouTube's Finest VR Content List
- 2024 Approved Fascination on Screen Top 6 Engaging Video Categories
- 8 Solutions to Fix Find My Friends Location Not Available On Oppo Reno 9A | Dr.fone
- A New Era of Commerce: Could a Friendly Face Be Among Us?
- Breakdown of Features in the Latest Microsoft Surface Laptop - Setting New Standards
- Evaluating the Razer Portal's Web Connectivity: Best Wireless Laptop for Gamers
- Forgotten The Voicemail Password Of Vivo T2 Pro 5G? Try These Fixes
- Innovative Chargeless Illumination: Evaluating the Robustness of Romer's Rechargeable Lantern
- Prime Capture Device Your Ally in YouTube Ventures for 2024
- The Perfect Blend of Style and Convenience: A Detailed Look at Swagtron's Chic and Swift Swagger Electric Scooter for Urban Travelers
- The way to get back lost videos from T2 5G
- Title: Essential PC Gaming Metrics Worth Tracking and Their Importance
- Author: Eric
- Created at : 2024-11-11 16:14:13
- Updated at : 2024-11-15 16:15:46
- Link: https://buynow-reviews.techidaily.com/essential-pc-gaming-metrics-worth-tracking-and-their-importance/
- License: This work is licensed under CC BY-NC-SA 4.0.